
The Competitive Life Cycle of Properties
How do properties age and how can that impact investment strategy?

More than a decade ago, Michael Mauboussin wrote Measuring the Moat, a research piece on competitive strategy which I have always enjoyed and admired. It deals with companies, but is relevant to the real estate industry, as properties are just businesses.
I started trying to put together my version of “Measuring the Real Estate Moat” but decided to break it up in the following five pieces, to increase the odds that I would complete it.
The following piece is Section 1, “The Competitive Life Cycle”
____________________________________________________________________________
1. Competitive Lifecycle.
How do companies change through their life cycle? Is there an analogy for real estate?
2. Industry Structure
5 Forces
Firm interaction
Paths of disruption
3. Industry Map
Profit pool
Value chain analysis
Smile curve of the industry
4. Types of Moats
Network effects
Economies of scale
IP and brand
Switching costs
5. Checklists to identify moats
Competitive Life Cycle of Properties
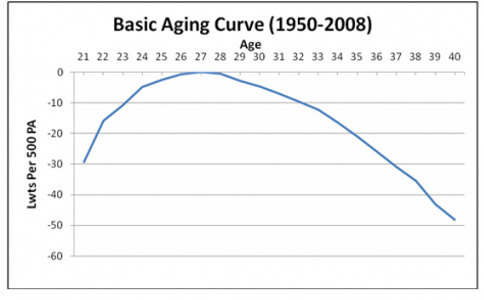
The “Moneyball” approach to data analysis in baseball led to many insights. One is the “aging curve” for players. While lots of players are great into their late 30s and even their 40s, most players peak in their late 20s, and then begin a rapid decline. Most of the bad contracts in baseball history have been given for too long, to a player who is too old, and to the wrong type of player (more on this in a future post). For example, Chris Davis and Albert Pujols were given 10-year deal at ages 30 and 31, respectively, when their best years were well behind them.
More recently, teams have taken a very different approach, locking up young players to control them through this peak. We have learned to sign players when they are 22, not 32.
Are there points in a property’s life cycle when it might be attractive to invest? Where is the future likely to be substantially better (or worse) than others expect? This is the question I’m interested in.
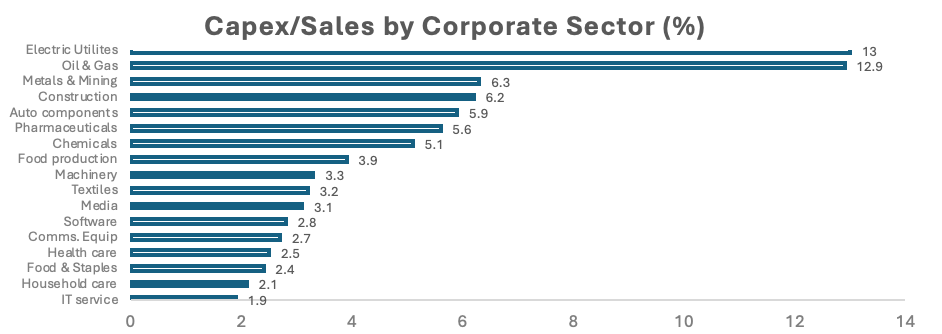
Just as baseball players require significant maintenance as they age, companies and buildings require substantial ongoing capital to compete for customers. More capital-intensive industries – such as airlines and Oil & Gas – are notoriously volatile and cyclical, better for trading. These sectors have capital needs far higher than others such as IT service and Household care.
Within an industry, every company has a life cycle. An “aging curve” if you will. Young companies are vibrant, with high growth rates and lots of potential. Just like ballplayers, as they settle into middle age, their returns normalize, and future potential and growth decreases.
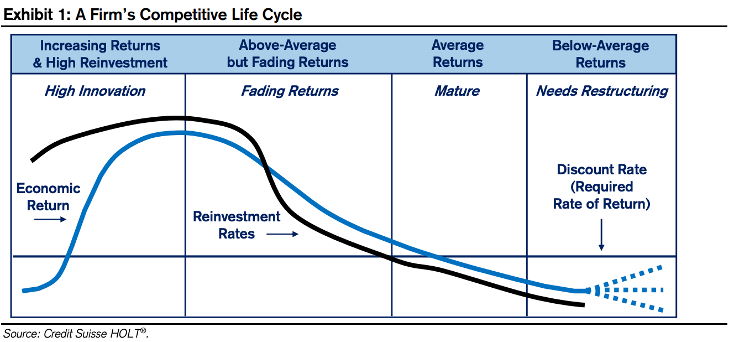
The graph below, taken straight from “Measuring the Moat”, demonstrates a stylized company’s aging curve.
1. High Innovation. Young companies, high ROI and opportunities. Lots of entry into and out of the industry at this cycle.
2. Fading Returns. Previous high returns attract competition, moving returns downward towards costs of capital. Competition and investment needs moderate.
3. Mature. Equilibrium.
4. Subpar. Competition and technological change push returns < the cost of capital. Companies restructure or reorganize.
Real Estate Implications
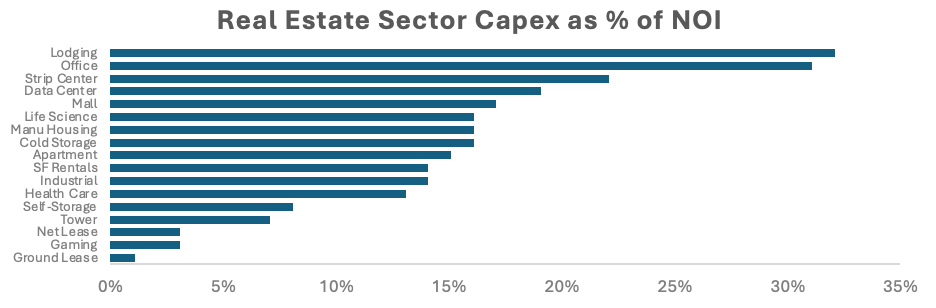
A property is a business, with customers and capital requirements. And real estate as an industry has high capital needs. As shown below there are large differences across the sectors. Hotels and office are the most capital-hungry sectors, the airlines and energy of the real estate industry, and similarly better for trading than for holding.
Self-storage and industrial are much more capital efficient, with simple structures that require little maintenance. Ground leases are most capital efficient since you only own the ground itself. This raises an interesting issue of “structure versus land” which we will revisit.
Real estate investors have historically had a challenge underwriting and pricing these capital needs. Some buy a property at an 8% cap rate and think that cash will hit their account every month, like a bond. Even better, they expect rents to grow. These investors are often disappointed, as stuff happens. Roofs get leaky and refrigerators break. Tenants turn over and new tenants cost money.
Owners must earn this projected rent growth, through regularly invested capital. This capital is required to counteract the 1. Physical obsolescence of the property (an aging structure) and 2. Economic obsolescence brought by changing demand patterns.
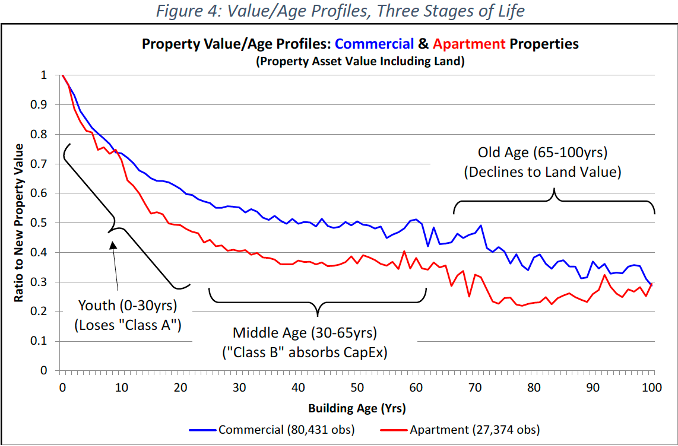
A few years ago, MIT released a paper that attempted to create something like an aging curve for real estate properties. Unlike both baseball players and companies, real estate is most valuable when it is brand new. From there it depreciates (in real terms), fighting a constant battle that the required capital improvements counteract.
Just like with baseball players, the decline is not linear. Instead, during the first years (ages 0-10 for properties, ages 28-35 for players) the decline is steep. During this period, the property falls from Class A to Class B. Once a property hits 20-30 years old, it is safely middle-aged and the declines moderate.
This analysis raises some questions:
· Why would you buy a new building? Wouldn’t it make more sense to buy buildings that are 10-20 years old, when their sharpest declines are behind them?
· I thought real estate kept pace with inflation? What is this talk of depreciation?
· Is this the same dynamic across all cities?
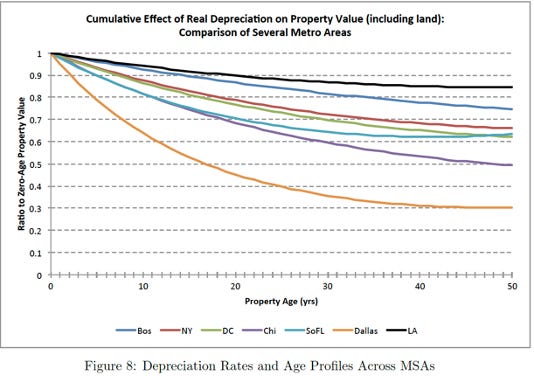
Let’s address that last one. In a subsequent paper, the same authors dug into metro data. As shown below, they found that the aging curve is vastly different across cities, ranging from 3% per year in Dallas to 0.4% in Los Angeles. In general, the markets with few supply barriers (Dallas, Houston, Phoenix, Austin, Atlanta) had the highest rates of property depreciation while those with higher barriers (LA, Boston, SF, New York), had the slowest rates.
Why would this be? When you buy a property, you are getting both a structure and the land. Through time, the land appreciates, and the structure depreciates. To overgeneralize, the more of your investment is comprised of land, the more your investment will appreciate through time. And vice versa. As a property gets older, land continually makes up more of your investment, so older properties depreciate less.
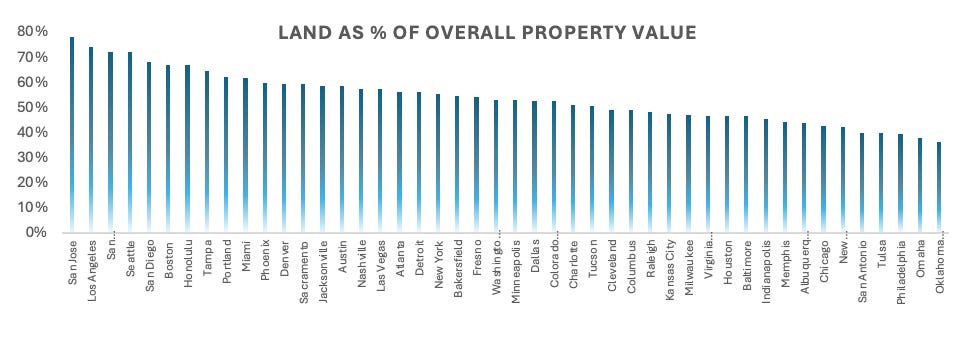
As shown below, for a typical property in Los Angeles, 70% of the value is land, and the structure is only 30%. This ratio is flipped in places like Omaha and Tulsa. This is why the rates of depreciation are so different and leads to the strategic decision to invest long-term in places that have higher barriers, high rents and high land values.
Let’s consider a quick example. Say you spend $100 million to buy a property in Los Angeles and $100 million to buy a property in Omaha. In LA you are really buying $70 million of land and $30 million of structure (see below) and in Omaha it is about $40 million and $60 million. You have twice as much “structure” in Omaha thus your long-term capex should be roughly double. Indeed this is what the other data from sources such as NCREIF and Green Street suggest
All else equal, investors should prefer those investments that require less capital. The real goal is to find investments where this need is significantly mis-priced. Let’s look at two multifamily properties that are currently on the market. A brand-new multifamily property in Denver and a 20-year-old building in Atlanta.
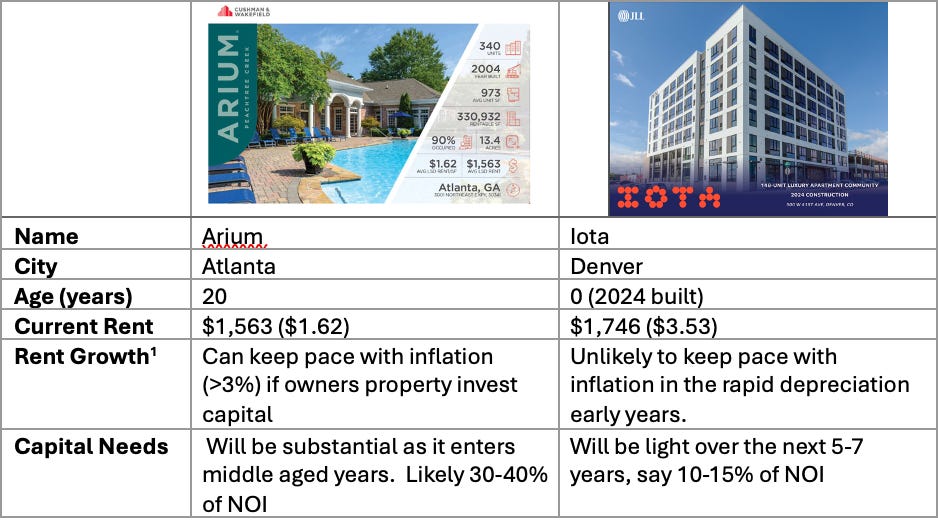
Neither one of these is necessary better or worse for investment today. It depends upon the price, and the underlying assumptions necessary to arrive at that price. I *think* conventional market consensus believes that newer properties offer higher rent growth (and thus investors will pay a lower cap rate). I would question that.
The main benefit to owning newer properties is the same as owning a new car: less stuff is going to break. But owning a pre-owned car is actually the smarter financial decision, you just need to set aside money to pay for repairs.
Some Takeaways:
1. While baseball players peak at age 27, properties peak at age 0, when everything is brand new. Both decline quickly over the next decade.
2. I argue that most investors don’t appropriately consider the amount of capital that will be required to maintain the competitiveness of the property. Rent growth and capex are two key underwriting assumptions and they are not independent, they are interrelated. Capex is needed, to earn the rent growth. If you are underwriting 3%+ rent growth, you better underwrite the capex to earn it.
3. Over the long term, what you really want to own is good land. The structure on top will depreciate and change.
4. The life cycle is more aggressive in cities with cheap land values and few supply constraints. Properties in Dallas age like Ryan Howard and those in New York age like Nolan Ryan.
5. Property-level NOI growth changes through the life cycle. In real terms, it depreciates roughly three times faster in the first decade than it does beyond age 30.
6. Physical obsolescence and Economic Obsolescence are different. Physical obsolescence can be countered with capital improvement. Economic obsolescence is harder and often requires wholesale redevelopment.
Sources:
GMT Research
Measuring the Moat, Michael Mauboussin
Green Street Advisors
Characteristics of Depreciation in Commercial and Multifamily Property: An Investment Perspective
Commercial Buildings Capital Consumption and the United States National Accounts
Statista, “Land price as a share of property value in selected cities in the United States in 2021”
Looking forward to this series. Thanks for sharing. Well done.