


9 Moneyball Insights to Consider for Real Estate Investing
What if Billy Beane joined our industry?

My two main interests are sports and investing. This gives the book Moneyball a special place in my heart. In this piece I offer some Moneyball-inspired data insights that could be applied to real estate. Most of these are rooted in human biases that have been slow to correct in real estate, due to the lack of great timely data and tools. This should offer analytically minded investors an opportunity that might have already been squeezed out of stocks, bonds and major league baseball. (note that I’ve cheated a bit and veered into other sports, but still in the spirit of Moneyball!)
Beware the "eye test". In Moneyball, Michael Lewis exposes how traditional baseball scouts discriminated against players who didn't conform to a narrow athletic archetype. Their preference for players who look like Mickey Mantle caused them to overlook players who look like Kevin Youkilis. By 2003, when Moneyball was published, this bias was slowly being capitalized on by teams like the Red Sox—with players like Kevin Millar and David Ortiz representing the new, data-driven approach to talent evaluation that helped the Sox win the World Series in ’04.
Potential Real Estate implication: Just as scouts overvalue good bodies, I believe that investors overvalue attractive buildings. Fund managers need to show their investors pictures and would rather get up at the annual meetings and show beautiful buildings in Tier 1 markets. This factor could bid these prices to elevated levels, depressing future returns.
I used to work at ADIA and recall working on a potential acquisition of a mobile home park portfolio. It would have been a great investment but didn’t stand a chance to get through IC. I remember thinking at the time that we should have put the pictures at the end (or not included them at all).
The aging curve! Baseball players face a clear “aging curve”, peaking between the ages of 26 and 28 and then decline sharply after that. This makes it very risky to sign older players to long-term contracts, which was more commonly done in the pre-Moneyball era

Potential Real Estate implication: Buildings follow an aging curve as well. Research done at MIT shows that the most rapid aging occurs in the years immediately following new construction. Owning properties in these years has its advantages, as they are less capital intensive. However, they also face more new competition. Investors and developers could ride this aging curve by selling immediately upon construction, and then buying at the shallower portion of the curve.

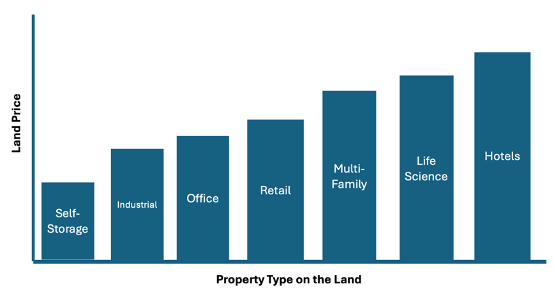
3. Beware drafting first basemen (and buying data centers). In baseball, not all positions are equally valuable or challenging. To quantify this, the godfather of baseball statistics Bill James created the concept of “Defensive Spectrum”. On this spectrum (shown below), positions on the left require more skill and athleticism. As players age, they move towards the right. Consider Gary Sheffield, who was drafted as a SS, played several years as a 3B, then moved to RF and finished his career as a DH.
Drafting a first baseman is risky, as they have a shorter shelf life, with nowhere besides DH to move as they age.

Potential Real Estate implication: There is a real estate spectrum as well. When drafting a player, the team is hoping the player will be valuable for a long-time. Drafting on the left of the spectrum increases the odds of this.
In real estate, developers build what is the highest and best use, at that time. However, as economies and locations change, this highest and best use evolves.
For a long time, office buildings were the highest and best use for urban land. Now, in many cases, they might be the worst use. We have recently seen office buildings that should be converted to residential, that had previously been converted from residential to office. Everything is dynamic.
This theory would suggest that buying self-storage or industrial properties is relatively low risk because they can only move one way on the spectrum. As cities evolve and zoning changes, those areas can potentially be utilized for more high value uses and the land value will increase. This creates asymmetric outcomes that hotels will struggle to offer.
4. Rethink everything! Until recently curtailed, major-league teams were using extreme defensive shifts to put players not just where they have historically been, but where the hitter is most likely to hit the ball. Similarly, managers have used relief pitchers to start games and get through the best hitters. Both tactics would have been unthought of only 20 years ago.


Potential Real Estate implication: Just because the way something has always been done, doesn’t mean it’s the best way.
What are some things that are “industry standard” that could be rethought?
· 12-month apartment leases and 5- and 10-year office leases.
· Expensive office buildouts that need to be redone for each tenant
· Traditional Financing tools
What else??
Don’t shoot mid-range jumpers. Over the last two decades, the NBA has evolved into a binary game, where players either shoot 3 pointers or layups. Data analysis has driven this. If players are successful with a layup or dunk 90% of the time, they get an expected value of 1.8 points on each attempt (2pts * 90%). If they can successfully make 40% of their 3-pointers, this would yield 1.2 points on each attempt. To match this, they would need to successfully make 60% of their mid-range jumpers. Recognizing this, the mid-range jumper has faded away.

Potential Real Estate implication: As always, the middle is a dangerous place to be. A few potential examples:
· Institutional investors could create their portfolios with low-risk bullet proof assets (dunks), paired with higher risk ground up development (3 pointers), and steer clear of the “value add” middle.
· Investors might pair to large, stable managers (dunks) and smaller, niche players (3-pointers)
· Maybe your target tenant should be closer to either high or low income to better serve their needs
· Maybe your hotel should shift either down or upmarket to better carve a position
Question the key indicators. When I was a kid, we fans cared about batting average, HRs, steals and RBIs. The message from the data revolution can be synthesized from one line from the movie: “Your goal shouldn’t be to buy players — your goal should be to buy wins.”
This gets to the root problem and leads to THE question: What really drives wins? A. Scoring more runs and B. Allowing fewer runs. Determining what impacts those two things revalues the stats that matter and fostered new and more informative stats such as WAR (Wins Above Replacement).
Potential Real Estate implication: Are there indicators we use that might not be that valuable? Two ideas:
· Office Rent per SF. Office don’t think this way, they think about the monthly burden and how the space helps them drive productivity.
· Apartment rent per unit, when what the tenant should really care about are ALL the costs (gas, commute time, etc.) they endure, and how their housing impacts each one.
What is the real problem your real estate is trying to solve? Are there other ways to measure it?
Be more aggressive than is comfortable. Data has shown that in the NHL, coaches should pull the goalie earlier than most people think. In the NFL data has led coaches to go for 4th down far more often than gut instinct might suggest.
Potential Real Estate implication: Humans have a self-preservation bias that leads to excess caution and desire for comfort. Within investors this can present itself in various ways. Maybe you need to sell earlier than you think. Maybe there are other risks in the business that are being avoided.
Seek out undervalued skills. Moneyball called out the value of drawing walks and getting on base as an undervalued skill. Similarly, shooting the corner 3 in the NBA has become a previously undervalued skill.
Potential Real Estate implication: Are there niches and pockets within real estate of overlooked value? A few examples:
· Raeden places small data centers in excess space in apartment buildings.
· STUF utilizes excess space in office buildings for self-storage uses.
· Solar and EV charging can be done in extra spaces.
All of these find revenue in overlooked areas. What else is overlooked and underpriced?
Measure the process in addition to the outcome. In baseball, launch angle and exit velocity offer a better view on a hitter’s ability than does batting average. The Pythagorean winning percentage shows what a team’s record “should” be based on the underlying runs and runs allowed. Both of these get to the underlying skill of a player and team, to help better identify normalized value.
Potential Real Estate implication: Sometimes you get a good result more through luck than process. A user decided to buy an office building you own. A change of zoning led to an unexpected increase in your land holdings. A data center developer just paid a boatload for your industrial site.
A more consistent investment approach could have “process” benchmarks. As an example, being clear on a specific thesis might allow for a “checklist” that you look for. Perhaps you are a seniors housing investor, and you want properties that are the following:
· Have a walk score of >70
· Were built after 2010
· Have expenses >20% higher than competitors
In this way, your process could lead to higher probability of a good outcome. It won’t be perfect, but could increase your batting average! Just like it’s possible to hit with a great exit velocity and make an out, having a checklist puts the odds in your favor.
Great post!
Fun analysis! What is the Hudson/Mulder/Zito in this metaphor (the under-appreciated secret to success?) Low rates? It's wild that the book is 20+ years old...
P.S. Tough L on the Mobile Home deal!